

Crafting a Pipeline to Catch the Ghost
An Adversary Detection Pipeline Using Grafana, Loki, Vector, Elasticsearch, Sysmon, And Atomic Red Team with Custom Threat Detection Rules
It all started when I was casually reviewing the Nginx access logs for my portfolio website and noticed that someone was attempting to brute-force directories on the server, seemingly searching for hidden or sensitive paths for WordPress directories. At that time, I did not have a log aggregator or a SIEM to monitor and detect attacks, and looking through logs in a log file wasn't easy either, so I started looking for a SIEM that met my needs. I wanted the SIEM to be open-source mainly because I support the open-source community, and I didn't want the SIEM to have half-baked features available for me to use while the other half was locked behind a paywall. I also wanted the SIEM to be fairly lightweight, as I was going to set it up on my server (Mini PC), which only had about 8 GB of RAM, and 2 GB of it was being used by Nginx and a few Docker containers.
ELK Stack (Elasticsearch, Logstash, and Kibana) and Wazuh are two of the most popular open-source SIEMs out there, but from my previous experience with them, they seem pretty heavy on the memory and CPU side, mainly because of the JVM and its heap size. Although we can reduce the default JVM heap size from 4GB, the three components of the ELK stack combined were slowing my server significantly. The same happened with Wazuh; its CPU usage was way too high for my mini PC. Because of this, I started looking for other open-source and lightweight alternativees, and that's when I found out about the LGTM stack (Loki, Grafana, Tempo, and Mimir).
Loki is a horizontally scalable, highly available, and multi-tenant log aggregation system, which might sound pretty similar to Elasticsearch, but its main difference is that Loki indexes only metadata (labels), while Elasticsearch indexes the full content of every log. At this point in time, I was only thinking about my server logs and didn't think much about Windows logs, and hastily decided to use Loki instead of Elasticsearch, which proved to be a mistake, as I later figured out that Loki is not suitable for collecting Windows logs as it only indexes labels.
As you can see from the above images, Elasticsearch is able to index more content than Loki, which is useful while writing detection queries. Although Loki might not be suitable for Windows and Sysmon logs, it was perfectly fine with Linux logs, especially for Nginx logs and SSH logs (from /var/log/auth.log). I used Vector, a lightweight, ultra-fast tool and log shipper, for building observability pipelines. Vector has a built-in parser for Nginx logs, which formats and extracts labels. This can be achieved using the parse_nginx_log function in the Vector Remap Language (VRL), as seen below.
[transforms.parse_access]
type = "remap"
inputs = ["nginx_access"]
source = '''
  = parse_nginx_log!(.message, "combined")
 filename = .file
 service = "nginx-server"
 device_name = "eepaserves"
'''
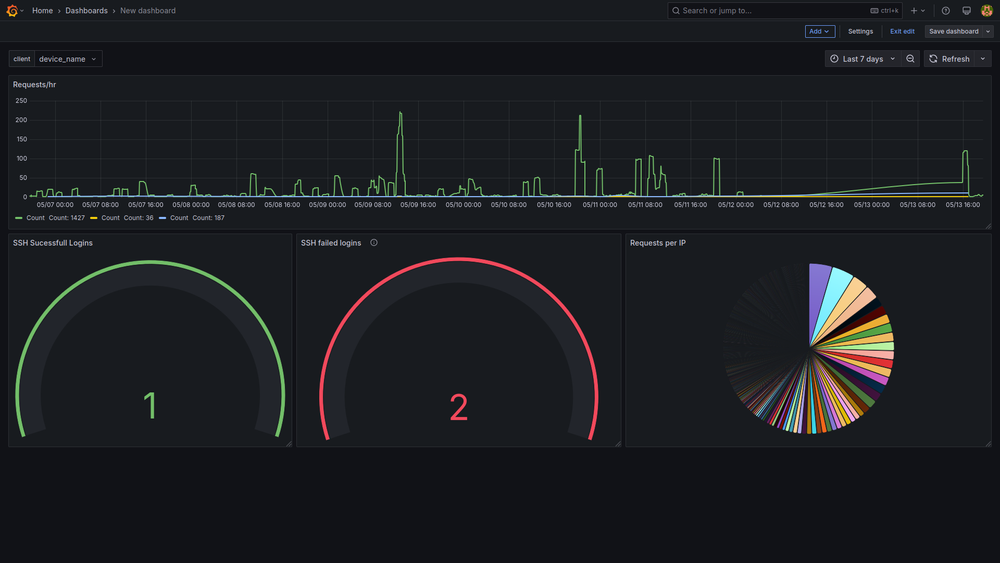
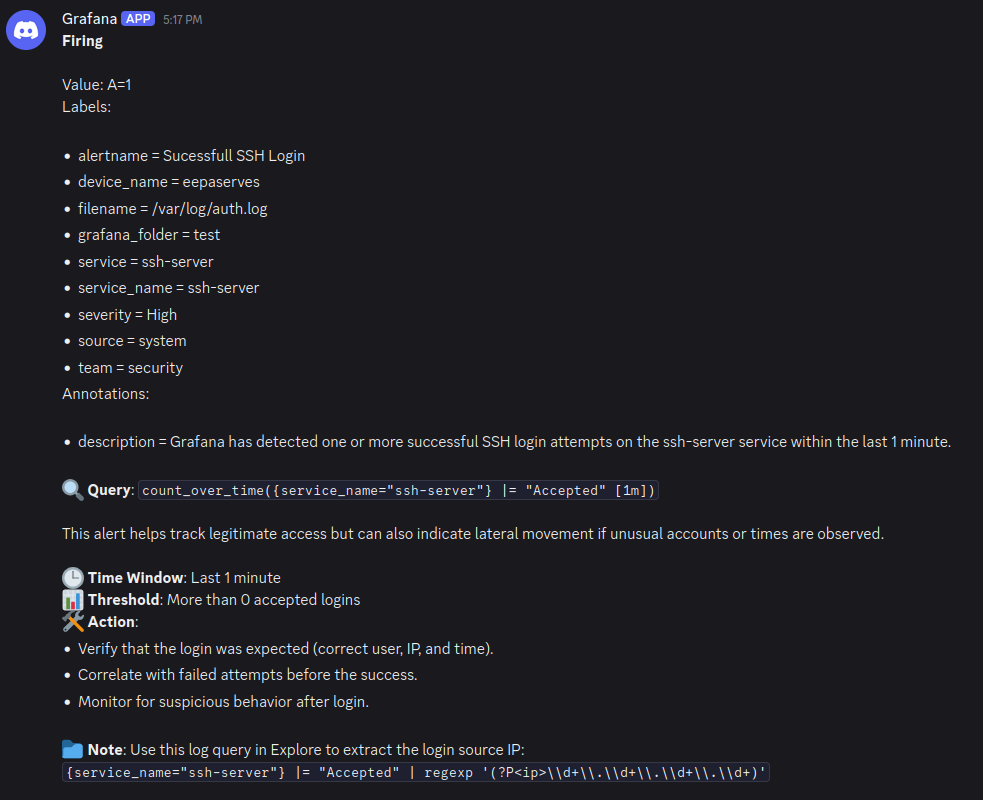
Grafana is a visualization tool similar to Kibana in the ELK stack. After installing Grafana, all I had to do was add Loki as a new connection and configure it from the Grafana dashboard, and I could see Nginx logs and SSH logs in Grafana. Grafana uses LogQL for filtering and creating alerts, so I wrote queries to detect a brute-force attack, an alert whenever there is a login attempt made using SSH, and another alert to detect if there was a successful SSH login. To get an alert, I had to create a contact point in the Grafana dashboard and choose Discord and Telegram among many other options, mainly because I already use both the apps. After creating the contact point, I tested if Grafana was able to detect and send an alert, and it seemed to detect and send an alert just fine.
Now that the Linux part was taken care of, I wanted to monitor Windows Sysmon logs. For Sysmon, I used SwiftOnSecurity’s config with a few changes to suppress the excess file creation logs (Event ID 11) created by Vector, as I initially used Vector for shipping Sysmon and Windows Security logs, which I eventually changed to Winlogbeat and Elasticsearch for reasons mentioned above. RAM usage spiked after installing Elasticsearch, which I solved by reducing the heap size from 4GB to 512MB and disabling a few features that I didn't need. At this point, the overall RAM usage of my mini PC was around 3GB.
After configuring Winlogbeat and adding Elasticsearch as the new log source from the Grafana dashboard, Grafana could now see Windows Sysmon and Security logs. For filtering and alerts, Elasticsearch uses Lucene, since Elasticsearch is built on top of Apache Lucene a powerful full-text search engine so I wrote a few alerts in Lucene query language and configured contact points to receive alerts (Discord and Telegram). I installed Atomic Red Team, an open-source library of tests designed to test an organization's security controls, to verify if my Lucene rules were detecting attacks or not an example of which can be seen below.
event.code:1 AND (winlog.event_data.CommandLine:(*reg* AND (*add* OR (*Run* OR *RunOnce* OR *Winlogon*))) OR (winlog.event_data.Image: (*pnputil.exe OR *powershell.exe OR *cmd.exe) AND winlog.event_data.CommandLine: (*add-driver* OR *install* OR *enable-driver* OR *-a* OR *-i* OR *.inf*)))This is a lucene query to to Monitor Autostart Persistence via Command Execution, Labeled under T1547 of the MITER ATT&CK framework, it covers methods adversaries use to achieve persistence by configuring malicious code to run automatically during system boot or user logon, where an attacker could install and enable various drivers and change registry keys to run a program during boot, is is simulated using the Atomic Red team which runs the following powershell commands.
pnputil.exe /add-driver "C:\Windows\INF\usbstor.inf"
pnputil.exe -i -a C:\Windows\INF\acpipmi.inf
reg add "HKEY_CURRENT_USER\Software\Microsoft\Terminal Server Client\Default\Addins\Malware" /v Name /t REG_SZ /d "C:\Windows\System32\amsi.dll" /f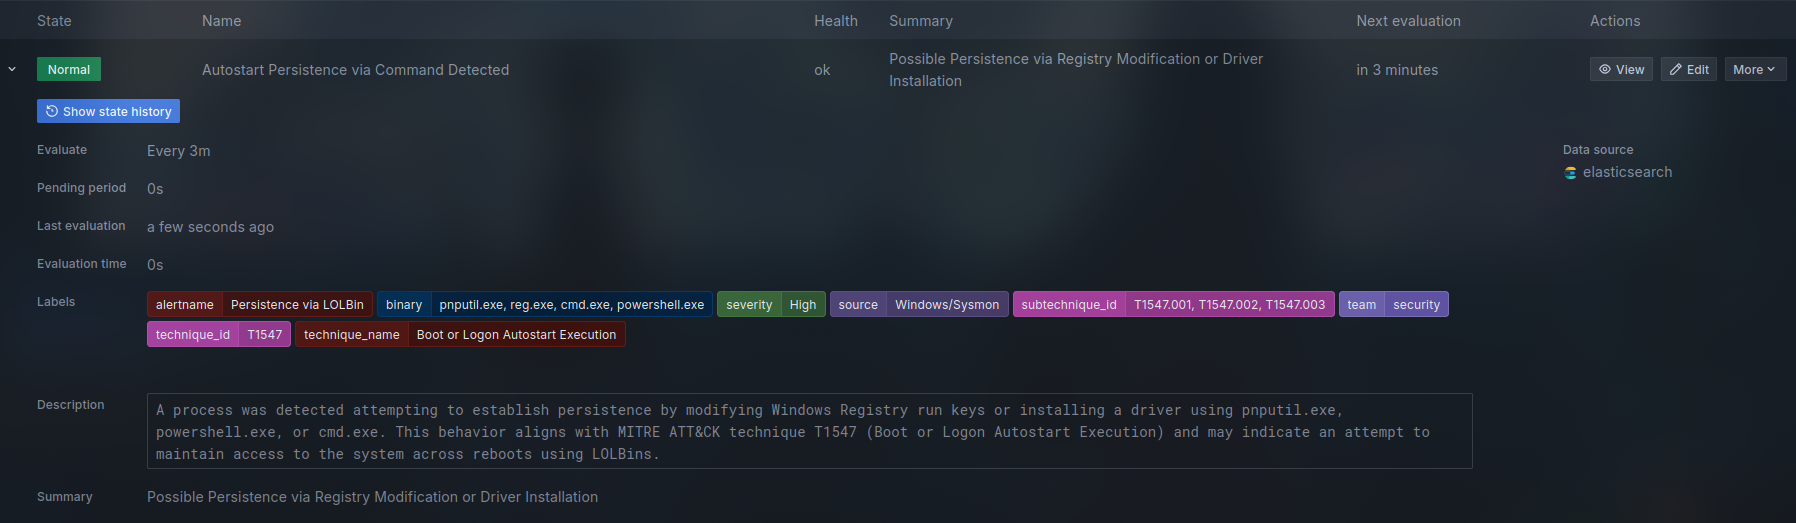
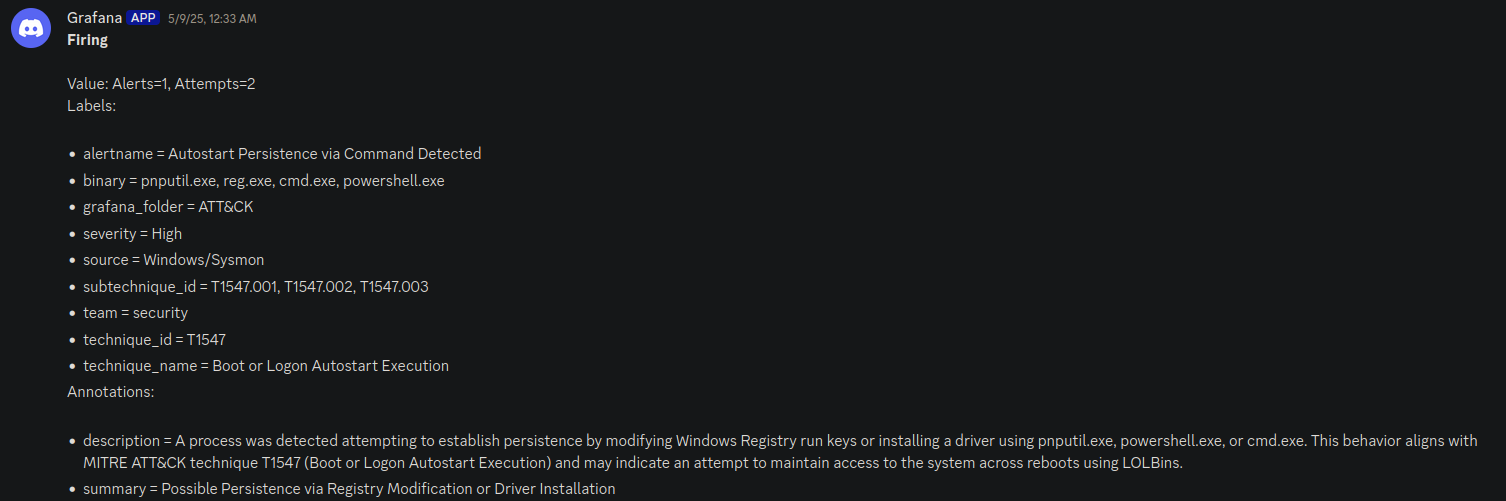
When the rule is triggered the state changes from Normal to Firing and an alert is sent to the configured contact points
Windows Security logs paired with Windows File Auditing were helpful as well, as Sysmon cannot log whether a program or user opened a file or not. This is helpful in detecting info-stealer malware, which tries to read contents from various application files and attempts to decrypt them using Windows DPAPI. This is defined in the MITRE ATT&CK framework under the ID T1555 (Credentials from Password Stores), where APT groups used various info-stealer malware such as LaZagne, and other Nirsoft tools such as NetPass, MailPassView, and WebBrowserPassView to extract and steal stored RDP, SSH, and browser credentials, among others.
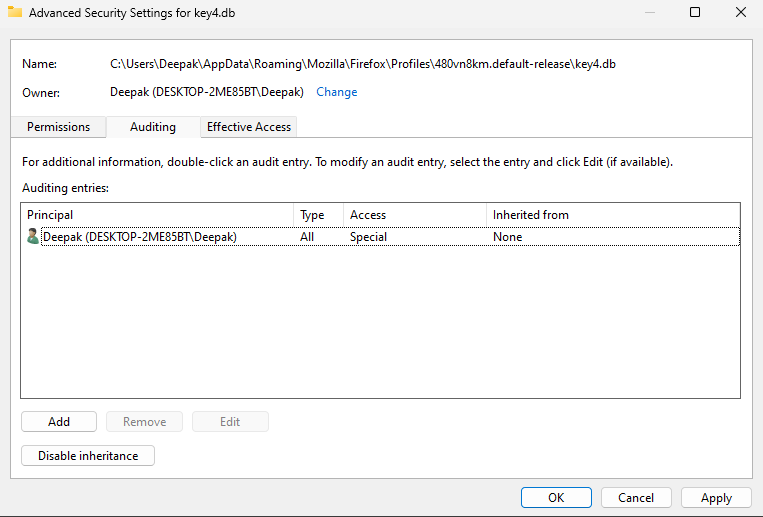
You can enable File Auditing from gpedit.msc or secpol.msc. I enabled Object Access Auditing, which is file auditing, using secpol.msc. I then created a new principal under auditing and enabled read, write, and modify detection.
(event.code: (5 OR 11 OR 1) AND
(winlog.event_data.Image:*WebBrowserPassView.exe OR
(winlog.event_data.TargetFilename: *.cfg OR winlog.event_data.Hashes: "F619A62A743BAA9F216B9AC90671DDD186930209E6B246A875DA0BC42BD8966B"))) OR
(event.code: 4663 AND winlog.event_data.ProcessName: *WebBrowserPassView.exe AND
(winlog.event_data.ObjectName: *logins.json OR winlog.event_data.ObjectName: *key4.db ))
And this is the Lucene query to detect whenever a program (which is WebBrowserPassView in this example) tries to perform credentials extraction from the Windows Password Store for Firefox..
This setup is not the most ideal and lacks certain features for log enhancement and broader integrations, as Grafana does not support modules for integrations such as AbuseIPDB like Splunk does. I am currently learning and working toward building a detection system that consumes as few system resources as possible, and I believe the current setup achieves that goal. I plan to work on a log enhancement solution as well, to gather more context around various IOCs, which would help improve detection and make alerting faster and more effective.
