

Log Enrichment Pipeline
A few days ago, I created an adversary detection pipeline using Grafana, Loki, and Atomic Red Team. It wasn't perfect and had its own issues, one of the major issues being log enrichment. Raw logs lack information that is necessary for faster incident response, reduced false positives, and better correlation. Nginx logs can be enriched using threat intelligence tools like AbuseIPDB. With the help of AbuseIPDB, we can find more information about a particular IP address, such as its geolocation and whether the IP has been blacklisted or not. SIEMs like Splunk come with built-in plugins for AbuseIPDB and VirusTotal, among other plugins. Grafana, on the other hand, does not come with log enrichment plugins. Although I could use alerts and webhooks, it is less than ideal, as the webhook would only be triggered when an alert is triggered. This method will not work if I want to enhance all the incoming logs.
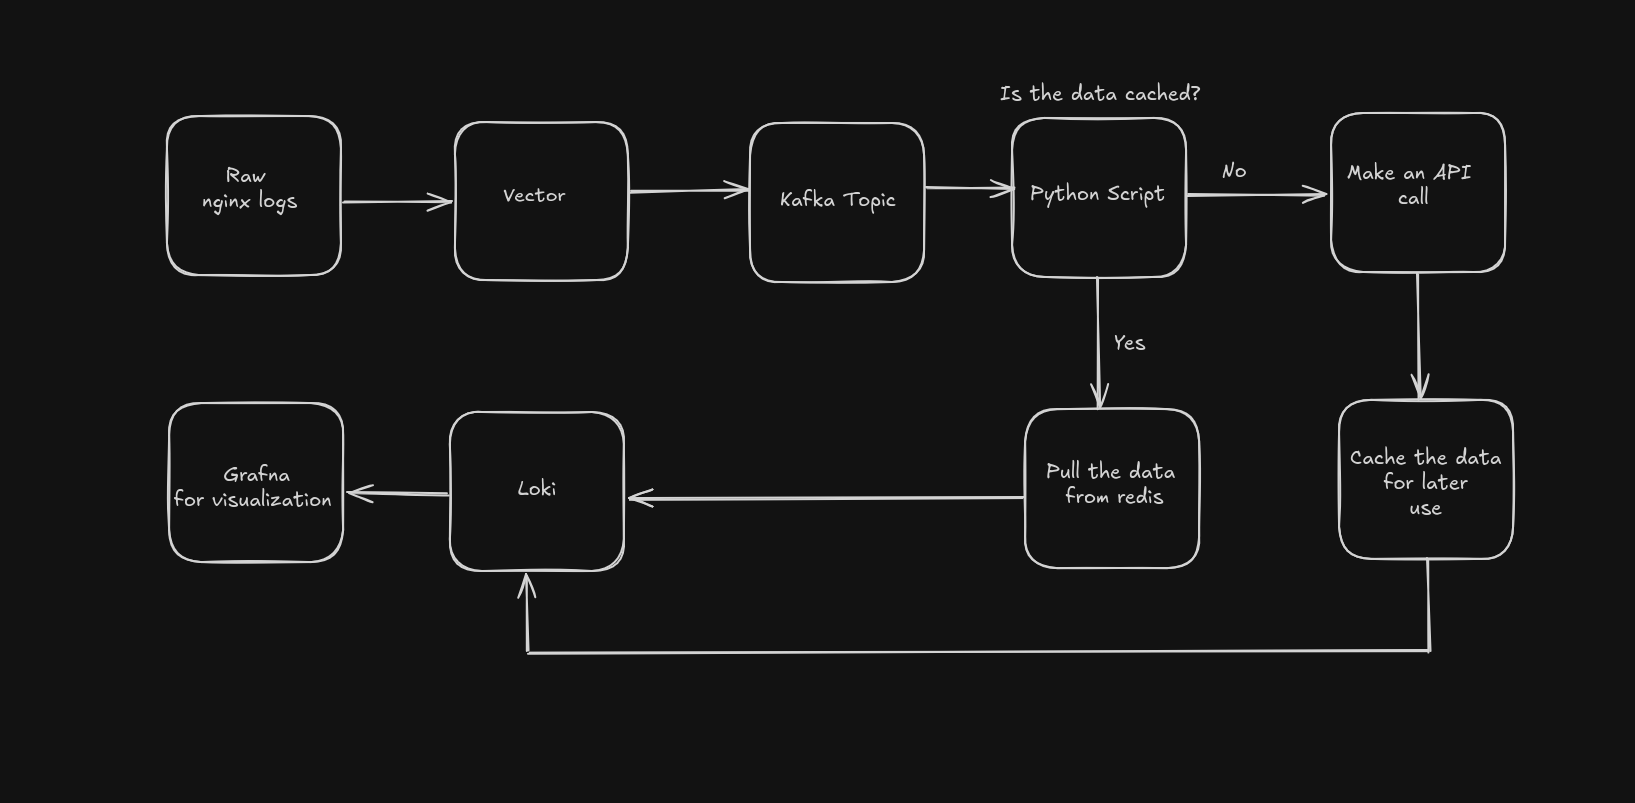
To solve this issue i used
- Kafka a distributed event streaming platform, as a temporary log storage, mainly for scalability, low latency and durability as it can store data on the disk,
- Redis as a cash to store data after making a API call to AbuseIPDB preventing multiple API calls for the same IP thereby saving time and number of calls made
- A python script to pull data from kafka topic, make the API call, store the data in redis for later use, append the data to the nginx logs and pushing it to grafana.
Vector has a built-in Kafka sink to send data to a Kafka topic. The raw Nginx logs are first parsed using Vector's built-in parser and forwarded to a Kafka topic with a retention period of 5 days, so logs are automatically deleted after 5 days. This time can be increased or decreased depending on the type and importance of the logs. The main purpose of Kafka in this setup is to act as a buffer/temporary log storage to prevent an overflow of logs if the downstream Python script is unable to keep up with the real-time log ingestion, which might result in potential data loss.
[sinks.kafka]
type = "kafka"
inputs = ["parse_access"]
bootstrap_servers = "<Kafka IP>:9092"
topic = "nginx-logs"
encoding.codec = "json"
compression = "snappy"
Creating a kafka sink in vector
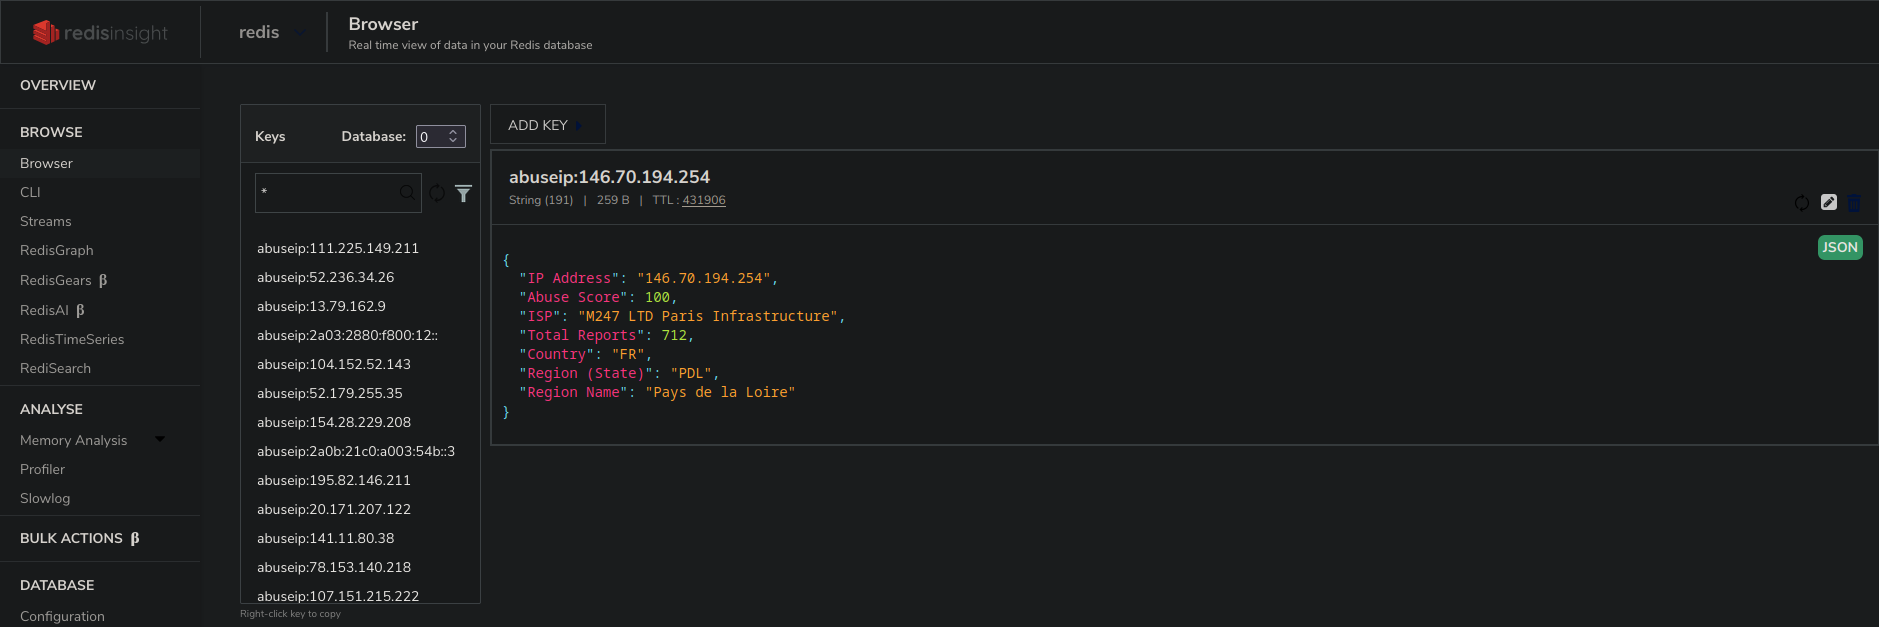
A Python script pulls logs from the Kafka topic and extracts the IP address from the logs. It then checks if the IP address is present in Redis, which is acting as a cache layer. If the IP address is not cached, the script makes an API call to AbuseIPDB to retrieve information about the particular IP. This data is then stored in Redis. AbuseIPDB limits its free users to 1,000 API calls per day. Caching the data helps reduce the number of API calls and also allows for faster log processing, as fetching from Redis is much quicker than making an API call. Each IP is stored in Redis in the format abuseip:<IP address>. The cache is maintained for 5 days. After 5 days, the cache expires, and if the same IP appears again, an API call is made to update the cache in Redis.
In the python script we will first initialized a Kafka consumer using the quixstreams library
app = Application(
        broker_address = "100.67.33.75:9092",
        loglevel = "DEBUG",
        consumer_group = "Vector_pull",
        auto_offset_reset= "earliest",

    )
We then subscribe(read) to the kafka topic which contains our logs, I named the kafka topic as nginx-logs so I we subscribe to that topic and start pooling for logs
with app.get_consumer() as consumer:
  consumer.subscribe(["nginx-logs"])
  msg = consumer.poll(1)
Each log is parsed from JSON, and the client IP is extracted using regex, along with logic to display a message ("Waiting...") when the script has no logs to process and is waiting for new logs.
while True:
            msg = consumer.poll(1)
            if msg is None:
                print("Waiting....")
            elif msg.error() is not None:
                raise Exception(msg.error())
            else:
                value = json.loads(msg.value())
                offset = msg.offset()
                extraction = value['client']
                print(extraction)
                match = extraction
                if match:
                    ipAddress = match
                    print(f"{offset}, {ipAddress}")
                consumer.store_offsets(msg)
                lookup(ipAddress,value)
After extracting the IP address we check if the IP address is already cached or not, if it is already cached we pull the data from the cache, if it's not cached an API call is made to fetch the details of the IP address abuseIPDB gives us Abuse Confidence Score, Total Reports and ISP. To get geo location about the IP a request it made to the ip-api to get Country code, region name, and the state code for that IP address.
def lookup(ip, val):
    API_KEY = "REDACTED"
    ipAddress = ip
    redisKey = f"abuseip:{ipAddress}"

    r = redis.Redis(host="localhost",port=6379,decode_responses=True)


    if r.exists(redisKey):
        print('Cache hit')
        abuseData = json.loads(r.get(redisKey))
    else:
        print('No cache')

        url = "https://api.abuseipdb.com/api/v2/check"
        params = {
            "ipAddress": ipAddress,
            "maxAgeInDays": 90
        }
        headers = {
            "Key": API_KEY,
            "Accept": "application/json"
        }

        response = requests.get(url, headers=headers, params=params)

        if response.status_code == 200:
            data = response.json()
            abuseData = {
            "IP Address": data["data"]["ipAddress"],
            "Abuse Score": data["data"]["abuseConfidenceScore"],
            "ISP": data["data"]["isp"],
            "Total Reports": data["data"]["totalReports"],
            }
        else:
            print("Error:", response.status_code, response.text)

        response = requests.get(f"http://ip-api.com/json/{ipAddress}")

        if response.status_code == 200:
            data = response.json()
            abuseData.update({
            "Country": data.get("countryCode"),
            "Region (State)": data.get("region"),
            "Region Name": data.get("regionName"),
            })
        else:
            print("Error:", response.status_code, response.text)

        r.set(redisKey, json.dumps(abuseData), ex=432000)

    print(json.dumps(abuseData, indent=2))
    val.update(abuseData)
    print(val)
    send_log_to_loki(val)
After the API calls, the data is stored in the cache for later use, reducing the number of API calls made and the time taken to process the logs. This is done using the redis library, after which we append this data to the end of our Nginx log.
//Raw nginx log
{
   "agent": "Mozilla/5.0 zgrab/0.x"
   "client": 128.192.12.124
   "device_name": eepaserves
   "filename": null
   "referer": -
   "request": "GET / HTTP/1.1"
   "service": nginx-server
   "size":8519
   "status":200
}

//Enriched nginx log
{
  "agent": "Mozilla/5.0 zgrab/0.x",
  "client": "128.192.12.124",
  "device_name": "eepaserves",
  "filename": null,
  "referer": "-",
  "request": "GET / HTTP/1.1",
  "service": "nginx-server",
  "size": 8519,
  "status": 200,
  "timestamp": "2025-05-26T07:59:26Z",
  "IP Address": "128.192.12.124",
  "Abuse Score": 14,
  "ISP": "University of Georgia",
  "Total Reports": 15,
  "Country": "US",
  "Region (State)": "GA",
  "Region Name": "Georgia"
}
The enriched logs are converted to Loki's format. The timestamp is changed from ISO to nanoseconds, which is a requirement for Loki, and then the logs are sent to the Loki endpoint.
def send_log_to_loki(log_dict):
LOKI_URL = "http://100.67.33.75:3100/loki/api/v1/push"
iso_ts = log_dict.get("timestamp", "")
dt = datetime.fromisoformat(iso_ts.rstrip('Z'))
dt = dt.replace(tzinfo=pytz.utc)
timestamp_ns = str(int(dt.timestamp() * 1e9))
print(timestamp_ns)
message = json.dumps(log_dict)
labels = {"job": "log-enhanser"}
payload = {
"streams": [
{
"stream": labels,
"values": [
[timestamp_ns, message]
]
}
]
}
headers = {"Content-Type": "application/json"}
response = requests.post(LOKI_URL, data=json.dumps(payload), headers=headers)
if response.status_code != 204:
print("Error:", response.status_code, response.text)
else:
print("Log sent to Loki")
if __name__ == "__main__":
try:
main()
except KeyboardInterrupt:
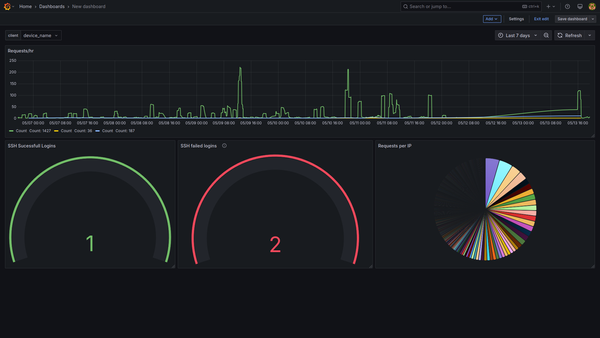
passThese logs can now be used for creating better alerts, informative dashboards, and visualizations using Grafana. This enrichment setup enhances raw telemetry with actionable insights, which are crucial for a modern-day SOC.
During testing on an 11th-gen i5, this setup was able to process around 15,000 logs per minute. This may vary depending on the CPU and processing power of the system. This setup enhances logs and also minimizes API hits, which is important since the AbuseIPDB free tier only allows 1,000 requests per day. It also makes the pipeline cost-effective and scalable.